

How Has the Day-Ahead Ancillary Services Market Gone?
Do you want confused market outcomes? This is how you get confused market outcomes.
Back in December 2024—remember the Biden days?—I wrote a brief analysis of ISO-NE’s revamp of their reserve markets, now called the Day-Ahead Ancillary Services (DA A/S) market. The new market went live on Friday, 28 February 2025, but the rollout was messy. On launch day, the eMarket platform that would have accepted DA A/S bids froze and crashed, as if its server had been overloaded. This is a problem, because that eMarket also manages regular day-ahead energy bids that utilities and power plant operators have to send anyway. ISO-NE temporarily widened the bid time window into midday, to ensure that everyone’s bids went through. And then the subsequent weekend turned out much colder than expected, breaking the forecasts that underpinned ISO-NE’s pre-baked bids for customers. This was an ill omen, but we’re talking software deployment. I don’t expect software deployments to go well.
Since then, the system has—in theory—worked just fine. At my company, we looked at the revised market structure, discussed our notes for a half-hour, and wrote up a script that simply bids our reserve-eligible resources at whatever ISO-NE says is the expected close-out charge. A month later, the on-staff turbo-quant1 ran a SQL query on our ISO-NE invoices and concluded that our net cash flow, between the old Forward Reserve Market and the new Day Ahead Ancillary Services Market, was flat.
My employer saw next-to-no change from this reform.
Now, that turbo-quant didn’t show me the “before” data, so I can’t confirm their assessment. And the actual data is confidential, so I can’t share any evidence. But from an anecdotal, N-of-one perspective, the DA A/S reforms did not change utility behavior.
The Day-Ahead Ancillary Services Market, Reviewed
Since writing my initial piece, ISO-NE released a handy-dandy chart running through what the new DA A/S market looks like. I’ve linked the PDF, but I’ve also reproduced the flowchart as a screenshot below:2
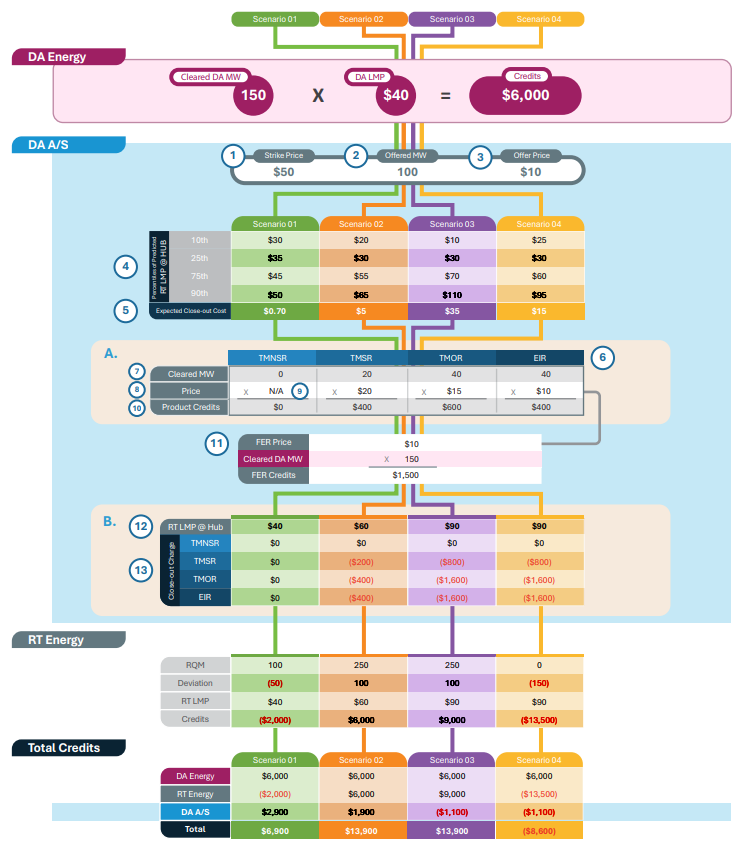
Clear as mud? Thought so. But I’ve stared at this graph enough to pick up its underlying message.
The point of the Day-Ahead Ancillary Services market is that you get paid if your reserves sit idle. If you clear in the DA A/S market, but you’re not called to run, you get that day-ahead credit. If you clear in the DA A/S market, and then you’re called to run, you’re rung up for a close-out charge based on how high the real-time energy price climbed relative to the day-ahead forecast. But ISO-NE thinks that’s okay, because if that close-out charge turns your DA A/S credits negative, you’ll still come out on top because your real-time energy revenue went up so high. And this balancing act works because both your close-out charge and your real-time energy credit are tied to the same underlying number: the real-time cost of energy, which in this case spiked higher than day-ahead forecast expected.
If that makes sense to you, you are either homo economicus or a computer.
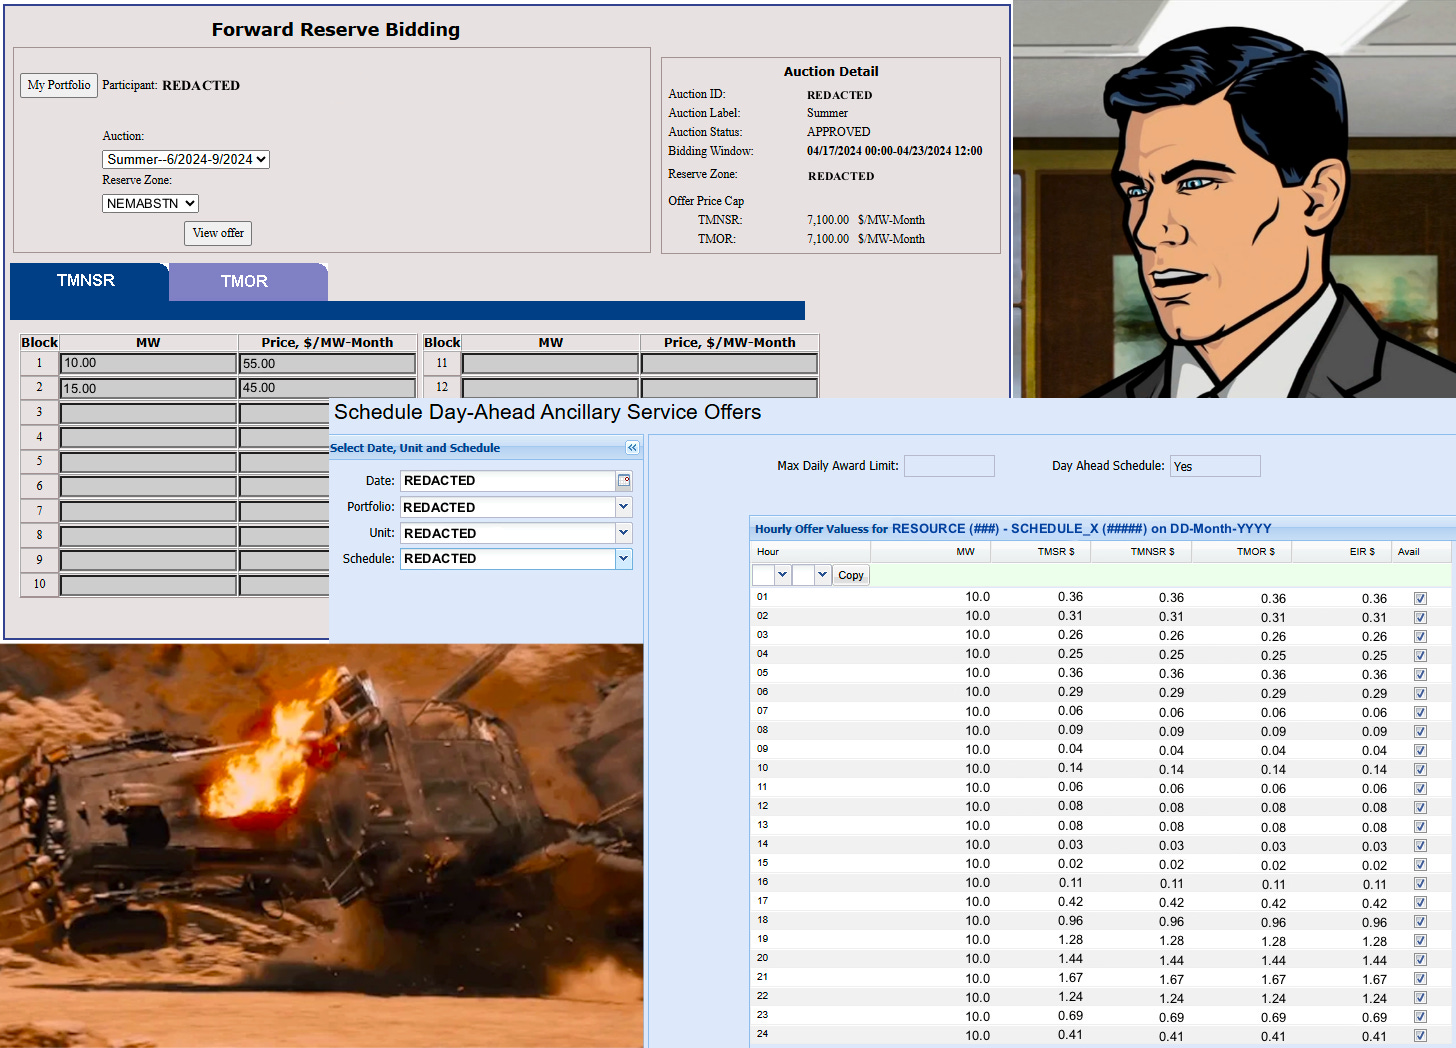
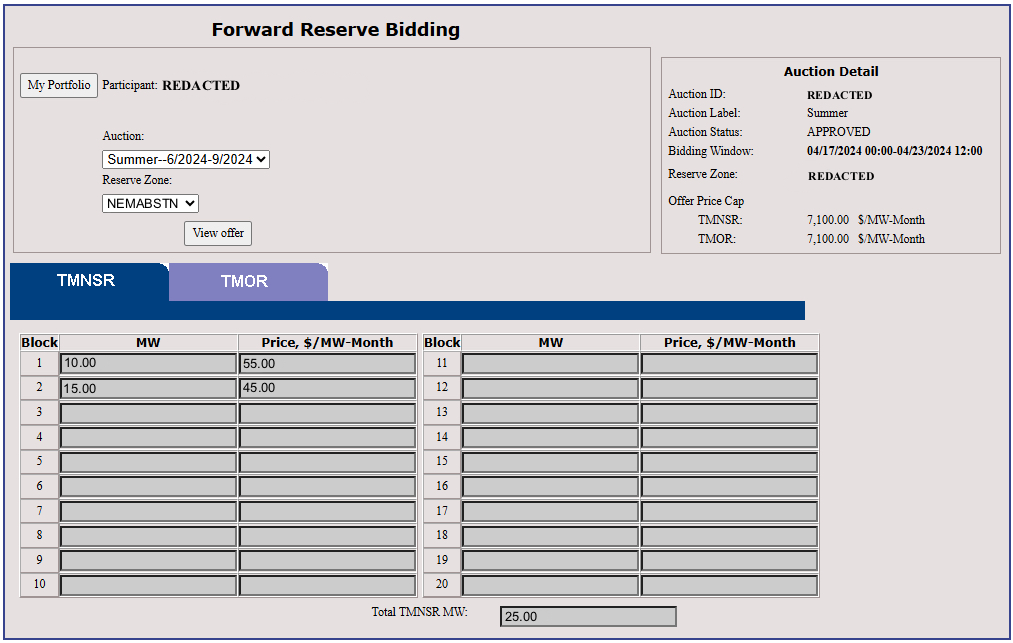
Compare this revised market to the outgoing Forward Reserve Market. In the old market model, you opened up this page twice per year and typed in your reserve-ready energy resources with an acceptable bid price in that delicious unit, dollars per Megawatt per month ($/MW-month).3 This number would feed into a Magic Market Machine that would return a series of daily line items with fun names like “Net Forward Reserve Credit” and “Net Real-Time Reserve Credit.”
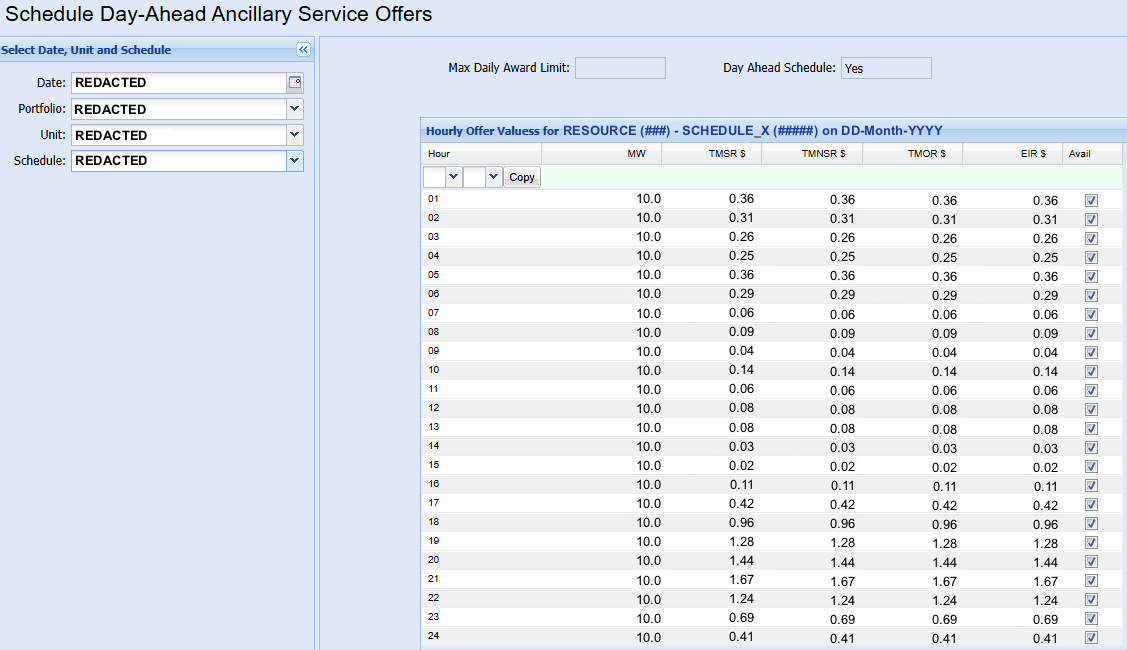
Now, you open up this page daily and type in some numbers that ISO-NE told you to enter (or else automate this process entirely), now in the unit dollars per Megawatt-hour ($/MWh). Your spreadsheet of numbers would feed into the very same Magic Market Machine returning a different series of daily line items like “Day-Ahead [Reserve Product] Credit” and “Day-Ahead [Reserve Product] Close-Out Credit.”
What an improvement. What a masterclass of clear market incentives towards grid resiliency.
But What About the Forecasting?
To me, the underrated “secret sauce” of ISO-NE’s reforms was that—for the first time I can think of—ISO-NE would begin forecasting prices in their own wholesale energy market. Per their June 2025 retraining of their price model, their forecasts are about as good as you can get:

If you’re an egghead, this is What Good Looks Like™️. As long as the model inputs are good, this is about as close to a crystal ball as one can get. The model seemed to completely miss the nightmare price spikes for the 23-24 June “heat dome,” but maybe that’s beyond the 90% confidence interval. Maybe?
But the real question is whether ISO-NE’s model is better than the hivemind forecast that is the existing day-ahead energy market. To this end, I tested ISO-NE’s strike price model4 against the day-ahead energy market’s clear price, comparing both to the real-time energy market’s clear price for the last week of May 2025 (Sunday 25 May to Saturday 31 May).
The results are…not favorable to ISO-NE:
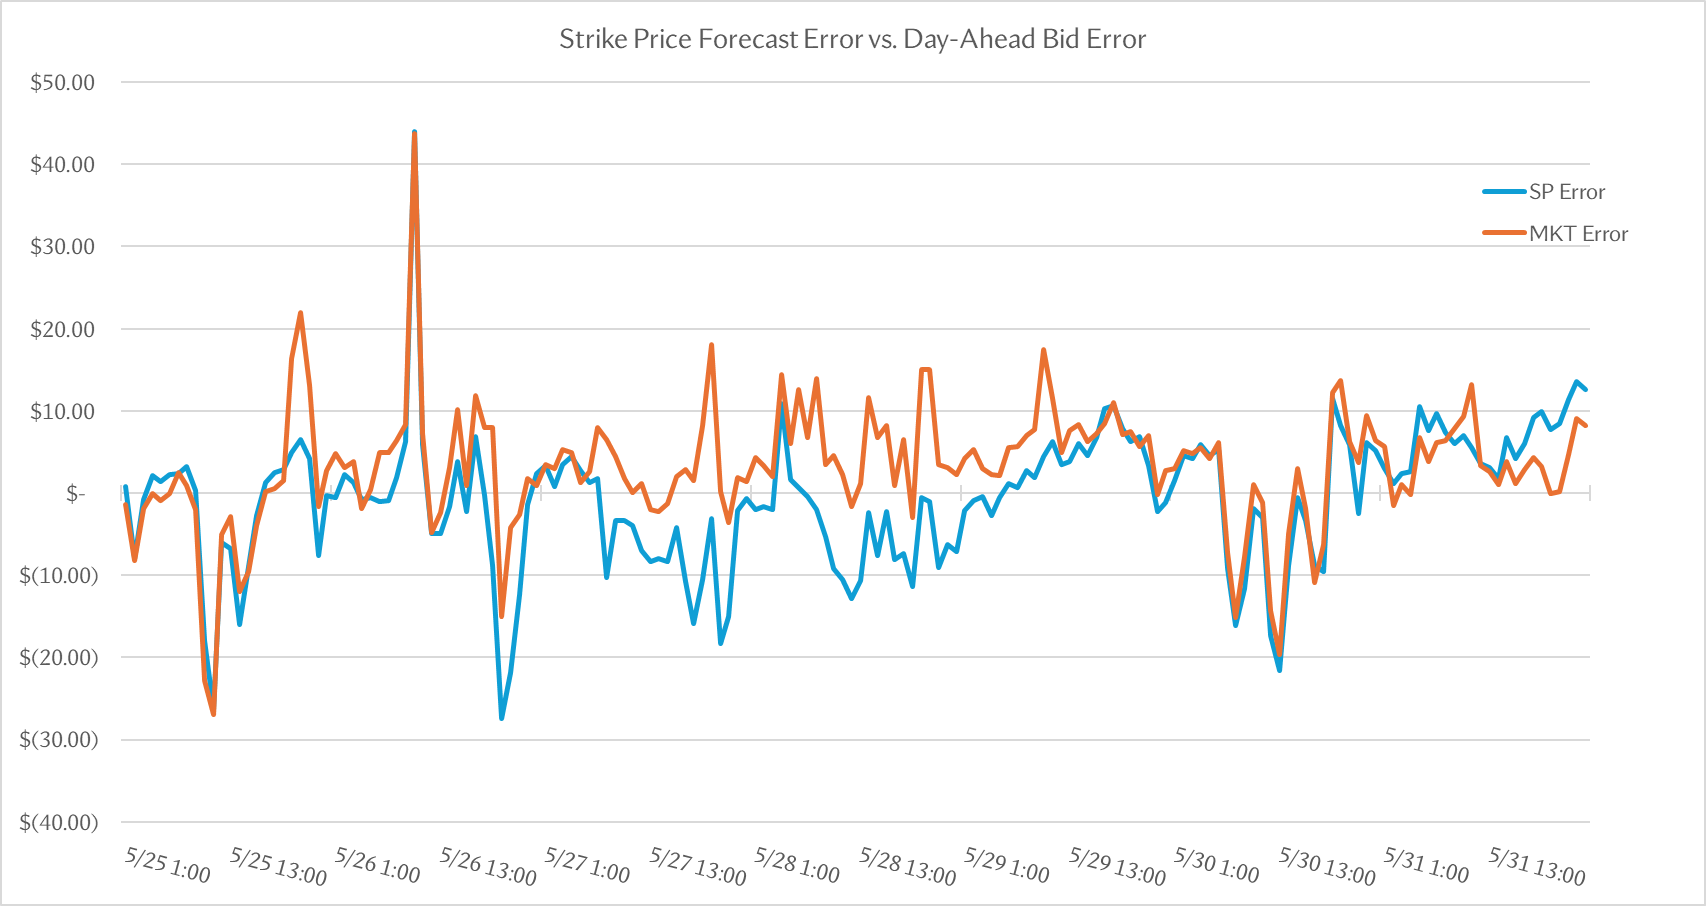
For this week of data, ISO-NE’s model has a mean average percent error (MAPE) of 22%, versus the market’s MAPE of 23.2%. ISO-NE’s model also has a root-mean-squared error (RMSE) of $8.41, versus the market’s RMSE of $8.22.
Again, ISO-NE’s model of real-time wholesale electricity prices for the next day is a good model. But it’s not better at predicting real-time prices than the market hivemind. This notionally makes sense, because the underlying factors of tomorrow’s electricity prices—weather, day of the week, spot gas and oil prices, incoming holidays—are public knowledge to anyone with an ICE or CME account. But I would have hoped that ISO-NE would have better information than random schmucks in the private sector—and failing that, I would have hoped that ISO-NE would give out a 10-day forecast so that I wouldn’t have to pay to procure my own, either from in-house development hours or from a third-party consultant.5
What Have We Accomplished Here?
The true promise of the Day-Ahead Ancillary Services reforms won’t show up during day-to-day operations—there are three real tests for seeing if these reforms work long-term:
Next time there’s a sudden generator outage or nightmare cold snap energy crunch, does the revised market structure allow for more accurate hedging for reserve power plants? As a result, does the grid see lower prices to keep enough electricity in the wires?
On a five-year timeline, does the revised market structure allow more gas- or oil-based generators to bid into reserve markets, bringing prices down?
On a five-year timeline, does the revised market structure enable combined solar-storage systems to bid into reserve, allowing for decarbonized energy reserves and new cash flows for renewable projects?
Of these medium-term design goals, I’m most excited about the promise of solar-storage systems finding a new cash flow. As we’ve discussed before, the existing PPA-based business model for intermittent renewables is due to break in…call it ten years:

On top of that, the current business model for battery storage systems is “peak shaving” to reduce capacity and transmission surcharges,6 which is a “Red Queen” market in which the market pushes everyone toward longer-duration batteries in order to maintain competitiveness. This business model is trending towards a slow death of diminishing returns.
Intermittent renewable energy resources need a new business model. But the more I learn about the people and businesses that install solar systems, the more I worry that no one in that industry is bright enough to build that new business model. And if the Day-Ahead Ancillary Services market is too obtuse and complex for me to understand fully and intuitively, it’s certainly too complex for the used car salesmen of New England energy.
UPDATE 2025-06-30: A Potential Loophole
I woke up, published this blog post, and re-ran this analysis for my boss today, because the Eastern American “Heat Dome” of 23-25 June 2025 proved a potential test case for the Day-Ahead Ancillary Services market. I briefly wrote about the event soon after it transpired:
Of the three days in question—the 23rd, 24th, and 25th of June—the 24th had the highest reserve credits. In fact, it was the highest single-day credit of the year so far! However, the flipside close-out charge was even higher, meaning that our participation in the DA A/S market was net-negative on the day our reserve assets were needed the most. On the flip side, spot prices for electricity were so high that we made good money anyway.
This is—notionally—how the DA A/S market is designed to run. But that got my boss thinking…what if, on a day we expected to run reserve assets but incur negative DA A/S revenue, we bowed out of the market but ran our reserve assets anyway? We’d pocket the high energy fees from being online during a high-price energy day, but avoid the net-negative returns on the DA A/S market.
I don’t know whether this arbitrage play will work. But if it does, ISO-NE has a big problem.
This post and the information presented are intended for informational purposes only. The views expressed herein are the author’s alone and do not reflect those of their current or previous employers or any elected officials. The author makes no recommendations toward any electric utility, regulatory body, or other organization. While certain information contained herein has been obtained from sources believed to be reliable, the author has not independently verified this information, and its accuracy and completeness cannot be guaranteed. Accordingly, no representation or warranty, express or implied, is made as to, and no reliance should be placed on, the fairness, accuracy, timeliness or completeness of this information. The author assumes no liability for this information and no obligation to update the information or analysis contained herein in the future
I am no turbo-quant.
If you want to follow this chart for yourself, remember that this toy-model power plant got $6,000 in day-ahead energy and $2,900 in day-ahead ancillary services.
This is a unit for electrical capacity, as used by ISO-NE’s Forward Capacity Market.

Note that ISO-NE’s model is for a reserve “strike price” that is $10 above their projection for the real-time energy market rate. I subtracted that $10 markup to get the underlying forecast.
I would weight that ten-day forecast with widened error bars, because weather forecasts rapidly lose accuracy beyond three days.
Remind me to explain the business model of battery energy storage systems—it’s not obvious to normal people.
https://www.iso-ne.com/static-assets/documents/2023/06/a03a_mc_2023_06_06__dasi_competitive_offer_formulations_memo.pdf
This was a pretty interesting read and displays a level of sophistication I honestly didn’t expect (at least they know they are getting participants to sell a call option and therefore should expect bids at the extrinsic value of that option). I would be really interested on the history of how they decided to go down the peg price route vs just copying CAISO (or other non peg price model, caiso just seems easy because they still have some
scarcity pricing mechanism)